By now, it’s almost a certainty that your company is using Google Analytics (or a similar alternative) to gather useful information on who your users are, what they’re doing on your website, and how they’re converting. However, most product owners use a “set it and forget it” strategy when setting up their analytics systems, and that leads to a few common mistakes that can render your data misleading or even wrong.
Mistake #1 – Incorrectly Setting Up Filters
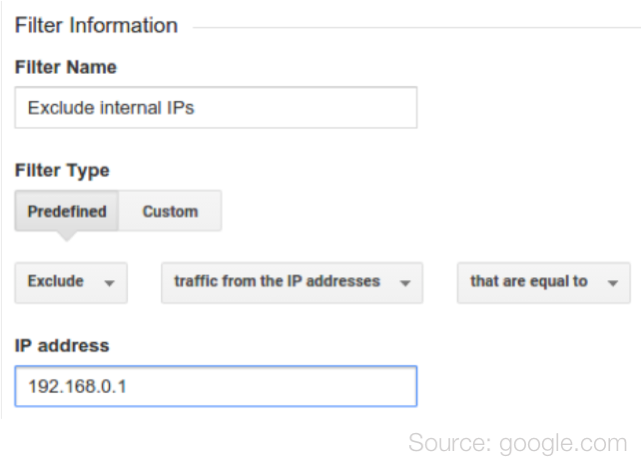
Setting up filters on your analytics properties can be incredibly beneficial if done correctly, but there are so many factors to take into consideration that it’s hard not to overlook some of the fringe cases. Say you’re trying to exclude internal traffic from being included in your dataset (which you should probably be doing, by the way). It’s intuitive that you exclude your company’s IP address, but in a time when more companies are adopting remote-first policies, it can often be forgotten to also exclude the IP addresses of remote offices and employees’ homes. Often, home IP addresses will not be static, so every several months it’s a good idea to monitor them to make sure they’re still the same.
Mistake #2 – Not Keeping a Raw Data View
When you establish a view on a Google Analytics property, only data moving forward will be included in it, because there is no retroactive filtering. So, when you first set up your Google Analytics account, be sure to include a “Raw Data View” that goes untouched, so that you always have a view containing every data point that you can reference in the future if needed.
The best practice recommended by Google is to set up your Analytics account with three primary views:
- Raw Data View: unfiltered and untouched
- Test View: to try out new filters/goals
- Master View: to use for all reporting purposes
Mistake #3 – Inconsistent UTM Tags
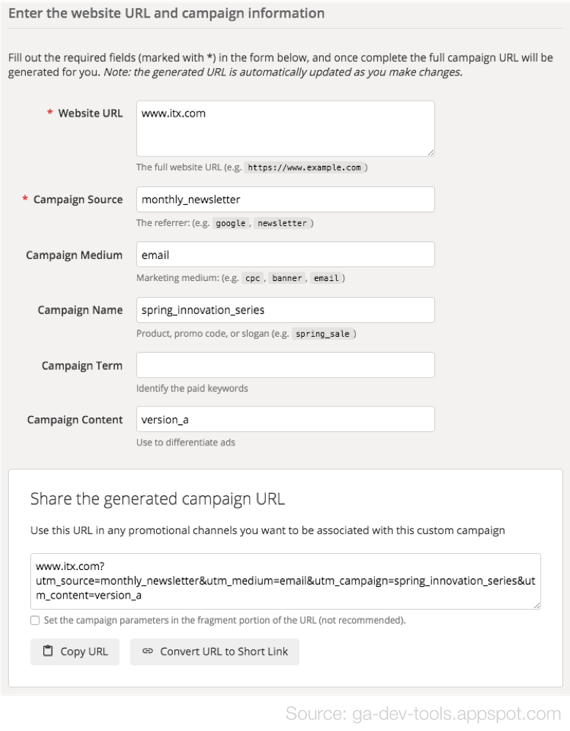
If you proactively use Google Analytics, you’re likely using UTMs to customize your campaign tracking. When done correctly, this can be an incredibly powerful way to give Google Analytics the extra information it needs to properly organize all of your data. However, it’s important to note that there is very little room for inconsistency when using UTMs, since any variance (misspellings, inconsistent capitalization, etc.) will result in the tags being tracked separately, and that will make it difficult to aggregate it later.
A simple solution is to use Google’s campaign URL builder tool to create proper parameters to add to your custom campaigns. It’s also a good idea to develop a campaign tagging strategy ahead of time and to continue to track your campaign tags currently in use so that you can ensure future tags remain consistent.
Mistake #4 – Not Setting Up Goals or Conversion Funnels
Whether your product or website is funnel-driven or not, you should be setting up important goals within Google Analytics to make tracking value added much easier later on. It’s also hugely beneficial to attribute dollar values to those goals whenever possible. Of course, you shouldn’t add random denominations when it’s impossible to know for sure, but if you have a concrete understanding of the value generated for your business, then you should add it to your goals.
For example, if you set a goal to track when a user signs up for a monthly subscription, then you could add the value of that subscription to your goal. This has multiple benefits down the line, such as attributing value to micro-conversions earlier in the funnel and highlighting your highest value content. Understanding how value is being attributed with your site (the stuff that keeps your business afloat) is incredibly important because it’s those activities that keep the lights on.
Mistake #5 – Not Sanity Checking Data
No matter how flawless we try to be, we’re only human, and mistakes sometimes get made. That goes for any number of things we do on a daily basis, and setting up your Google Analytics account is no exception. This is why it’s crucial to periodically reconcile your Google Analytics data against any other data sources your company uses to ensure you’re not missing/misrepresenting anything.
Some examples of other data sources to consider are any sort of baked-in analytics (if your site is running on a platform like WordPress or Sitecore) or your CRM that’s tracking registrations or other conversions. While keeping the time frame consistent, pick a couple of basic metrics (unique visitors, conversions, etc.) and compare them between the two sources. It’s okay if the two sources don’t match exactly because the most important thing is that they are more or less telling the same story.
Mistake #6 – Tracking Everything, But Not Knowing Why
All too often, companies take on the tactic of tagging every element of their site with the intention of figuring out what they want to track later. The result is a mountain of valuable data on your users and no strategy to interpret it with, and this leads to constructing a biased narrative to fit whatever data you’re seeing.
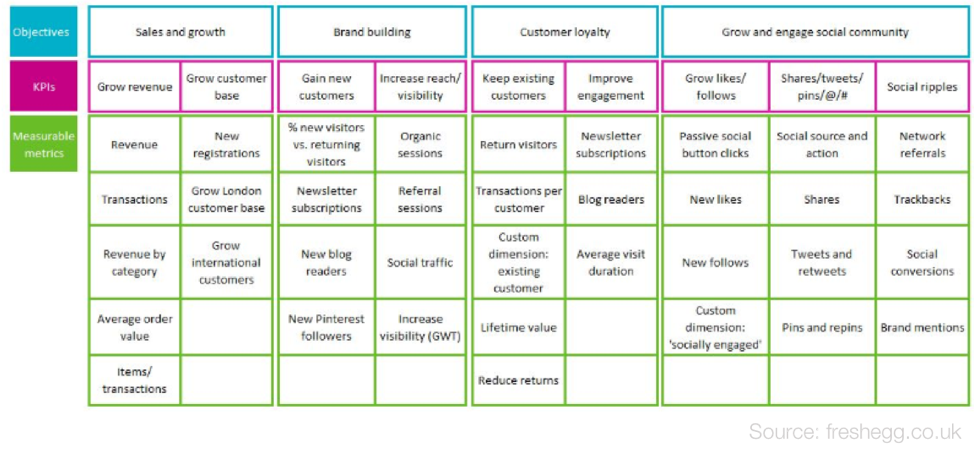
Instead of senselessly tracking everything, companies should be deliberate with what they choose to track. There’s no issue with tracking everything under the sun, but only as long as you have specific things you agree to look for upfront, and ideally with expected target values. There are numerous ways to craft your analytics strategy, but one of the simplest is filling in a measurement plan to ensure that the metrics most important to you (like your pKPIs) are actually being focused on.
Mistake #7 – Misinterpreting What Metrics Mean
Not every metric is meaningful for every product and website. Take bounce rate for example. The bounce rate indicates how many visitors view only one page before leaving without further interaction. A high bounce rate is almost always perceived to be negative. However, it’s all dependent on the specific product or site. On YouTube, visitors load a page that auto-plays a video, then they usually click out to another video or close the tab. Although this would technically count as a “bounce,” the user performed the exact action that YouTube wants them to.
Another example of misinterpreted metrics is time on page, which is often interpreted as your users having difficulty on a particular page. However, if you’re a content-dense website like the Social Science Research Network (SSRN), your pageview durations will be significantly longer than a form-driven page intended to progress users quickly, like a newsletter registration. That’s not to say one is better than the other; they simply have different objectives.
Mistake #8 – Not Reviewing Your GA Data Frequently
You can set everything up correctly and be collecting valuable information on your users, but it’s possible for all of that effort to be for naught if you don’t fully commit to reviewing the data frequently enough or using it to make data-decisions. Some of the best Product Owners even make a habit to review analytics every morning from the day before to keep their finger on the pulse of their users.
References:
Attribution. UTM Tagging Best Practices. https://www.attributionapp.com/blog/utm-tagging-best-practices/
Julian Erbsloeh (2018, February 2). How to Create a Measurement Plan and Why You Really Need One. https://www.freshegg.co.uk/blog/analytics/performance-measurement/how-to-create-a-measurement-plan-and-why-you-really-need-one
Sean Flaherty (2017 February 2). Journey Framework with pKPIs.
Sean Flaherty (2016, April 22). How Tuned Into Your Customer Are You?


